
Performance tab
ICMP/SNMP Polling & Fleet Performance
Underneath every green dot is a real poll engine. This tab is where that engine's output rolls up into the numbers ops checks every morning.
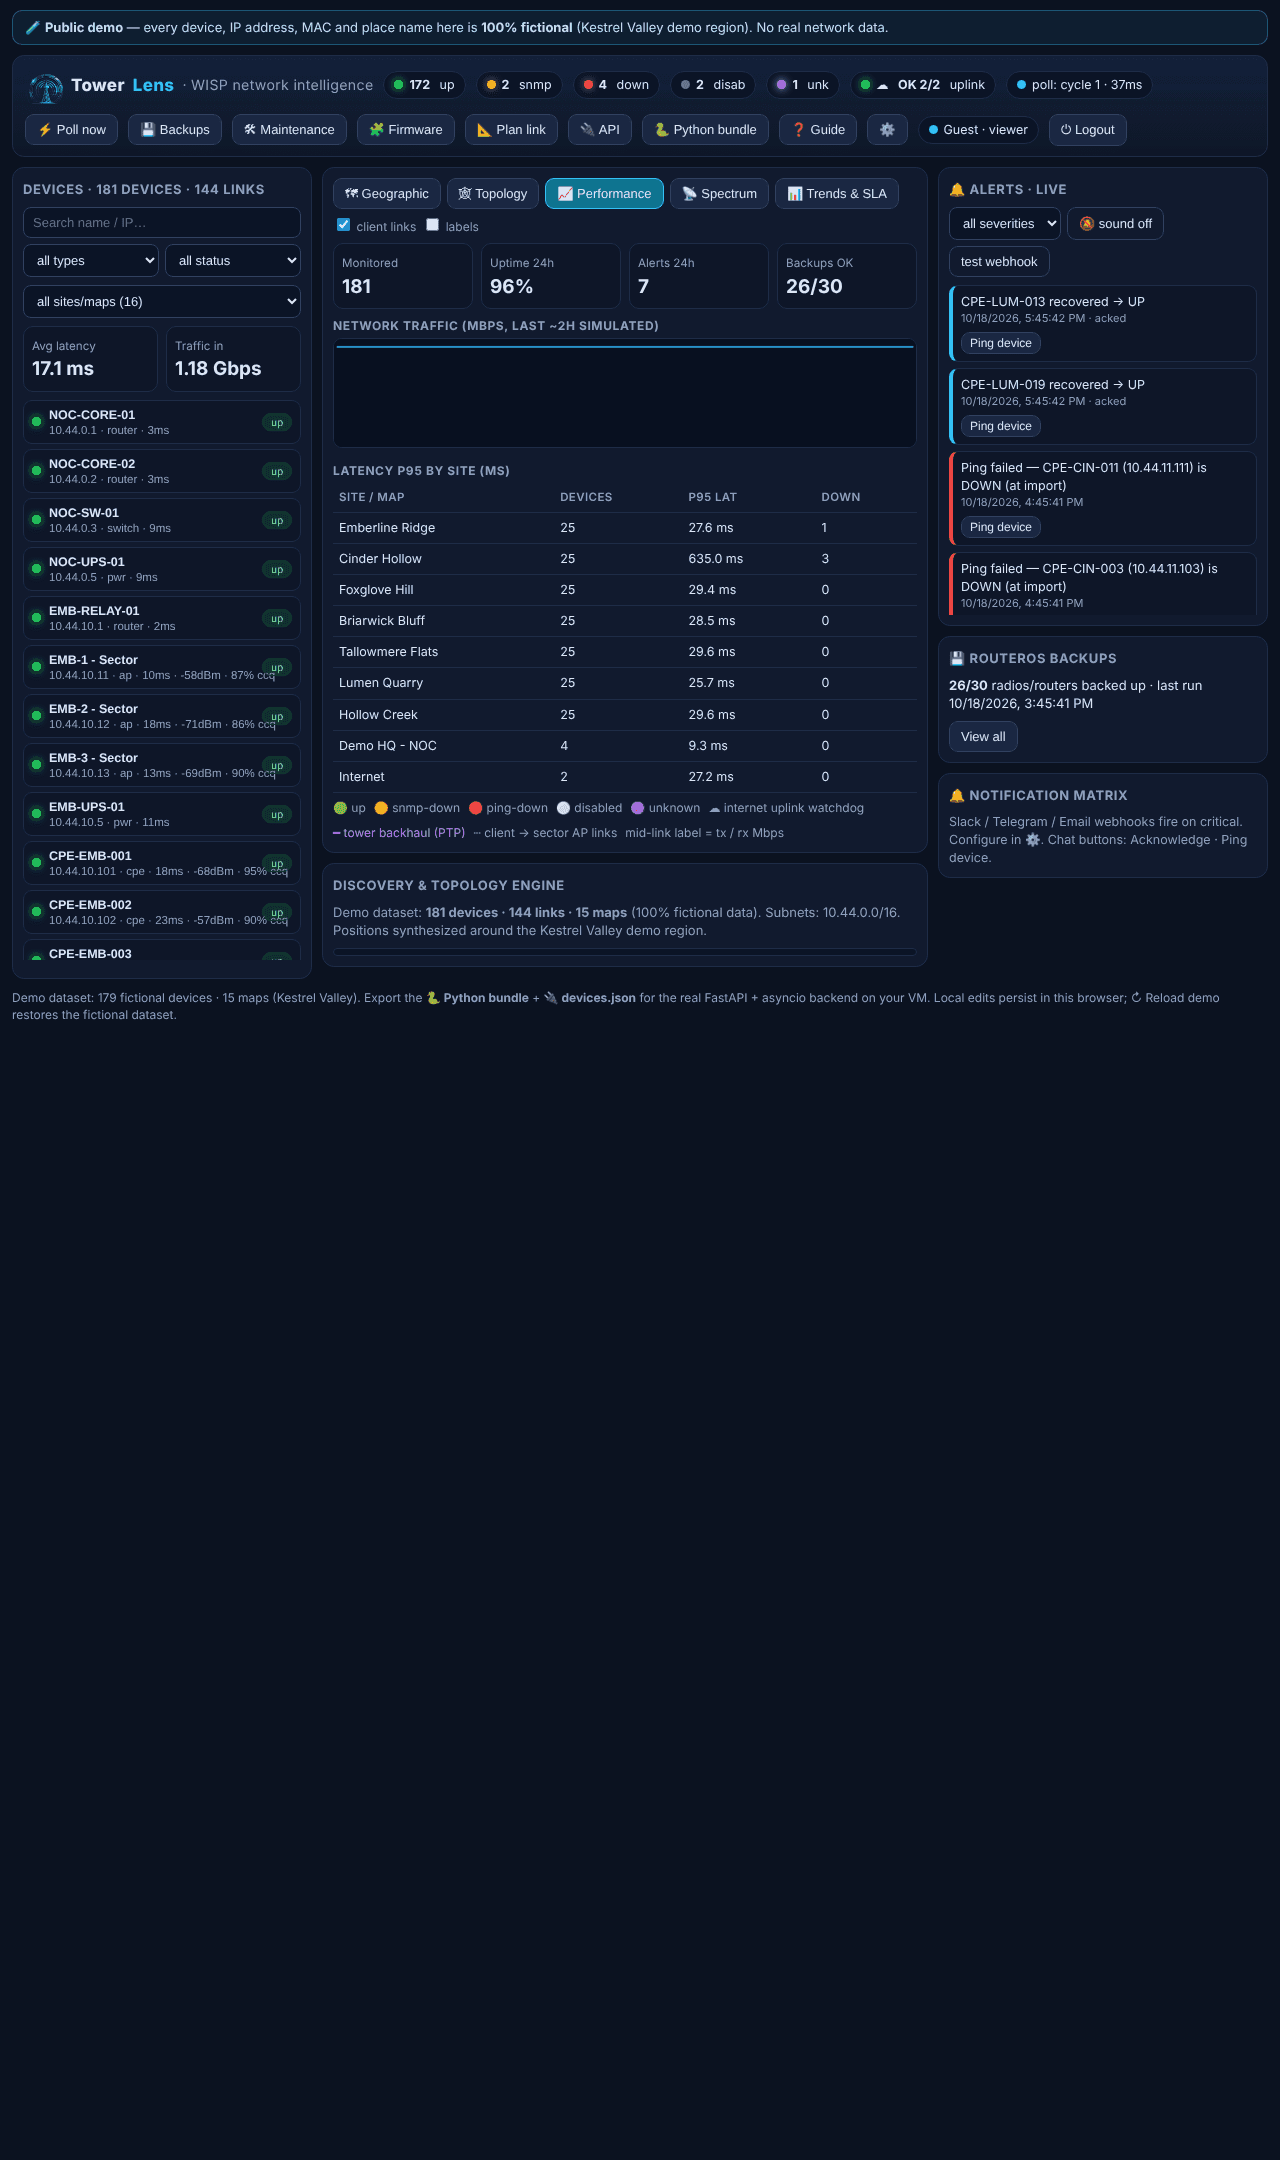
The poll engine
Every device is polled on a configurable interval: ping with a two-round retry before anything is marked down, SNMP get for anything ping alone can't tell you, and port probes where relevant. Link state is inferred rather than assumed, and status moves through a proper state machine — up, SNMP-down, ping-down, disabled, unknown — instead of a flat binary flag.
What the tab shows
Fleet-wide traffic over the recent window, p95 latency per top site, and rolling counters for uptime, alert volume and backup success — the fast morning-check view before anyone drills into a specific device or site.
Vendor-neutral by design
MikroTik, Cambium, Mimosa and other common wireless gear is auto-detected for display purposes, but ping/SNMP monitoring itself stays vendor-neutral across the whole fleet — the same poll engine watches everything, regardless of brand.
Where it fits
For history beyond this live window, see Trends & SLA reporting; for noise floor and channel-level detail behind a wireless link, see Spectrum scanning.